REPORTING TAB
JOBVIZER CRM VIDEO TUTORIAL
Attribution Reporting
Two core attribution report types:
Conversion Reports — shows which sources are actually producing conversions
Source Reports — breaks down where contacts are originating from
Both generate an overview dashboard plus individual contact-level detail, useful for following up directly with specific leads rather than only seeing aggregate numbers.
Advanced/Custom Reporting
For needs beyond what's built in, natively available data can be pulled out via the REST API and webhooks (contact, pipeline, conversation, and campaign data), and connected into external tools like Looker Studio, AgencyAnalytics, or a middleware tool for fully custom dashboard builds. This is an advanced setup requiring some technical/API familiarity, not a default out-of-the-box option, but it's available when a client's reporting needs genuinely exceed native capabilities
What Reporting Covers
Reporting pulls live data from across the entire system, contacts, pipelines, appointments, calls, campaigns, and ad performance, into configurable dashboards, so performance can be reviewed without opening five separate tabs or exporting to a spreadsheet manually. Reporting is spread across a few areas: a main account dashboard, dedicated analytics dashboards that can be customized, and reports embedded directly inside specific modules (like pipeline stats inside Opportunities).
Worth setting expectations on: this system is strong for pipeline, appointment, call, and campaign-level data, but it doesn't replace tools like Google Analytics or Search Console, and it doesn't natively track ad spend or impressions (that still lives in the ad platform itself). It complements those tools rather than replacing them entirely.
Building a Custom Dashboard
Default dashboards tend to show raw activity volume, useful, but not the same as tracking whether that activity is actually converting.
Go to Analytics → Dashboards → Create Dashboard.
Add core performance metrics rather than just activity counts:
Conversion Rate — contacts that become customers, by pipeline stage
Revenue — total closed-won value this month vs. previous months
Response Time — average time from lead creation to first contact
Appointment Show Rate — percentage of booked appointments that actually occurred
Arrange widgets in the order that matches how the business actually reviews performance (highest-priority metric first).
Save.
Call Reporting
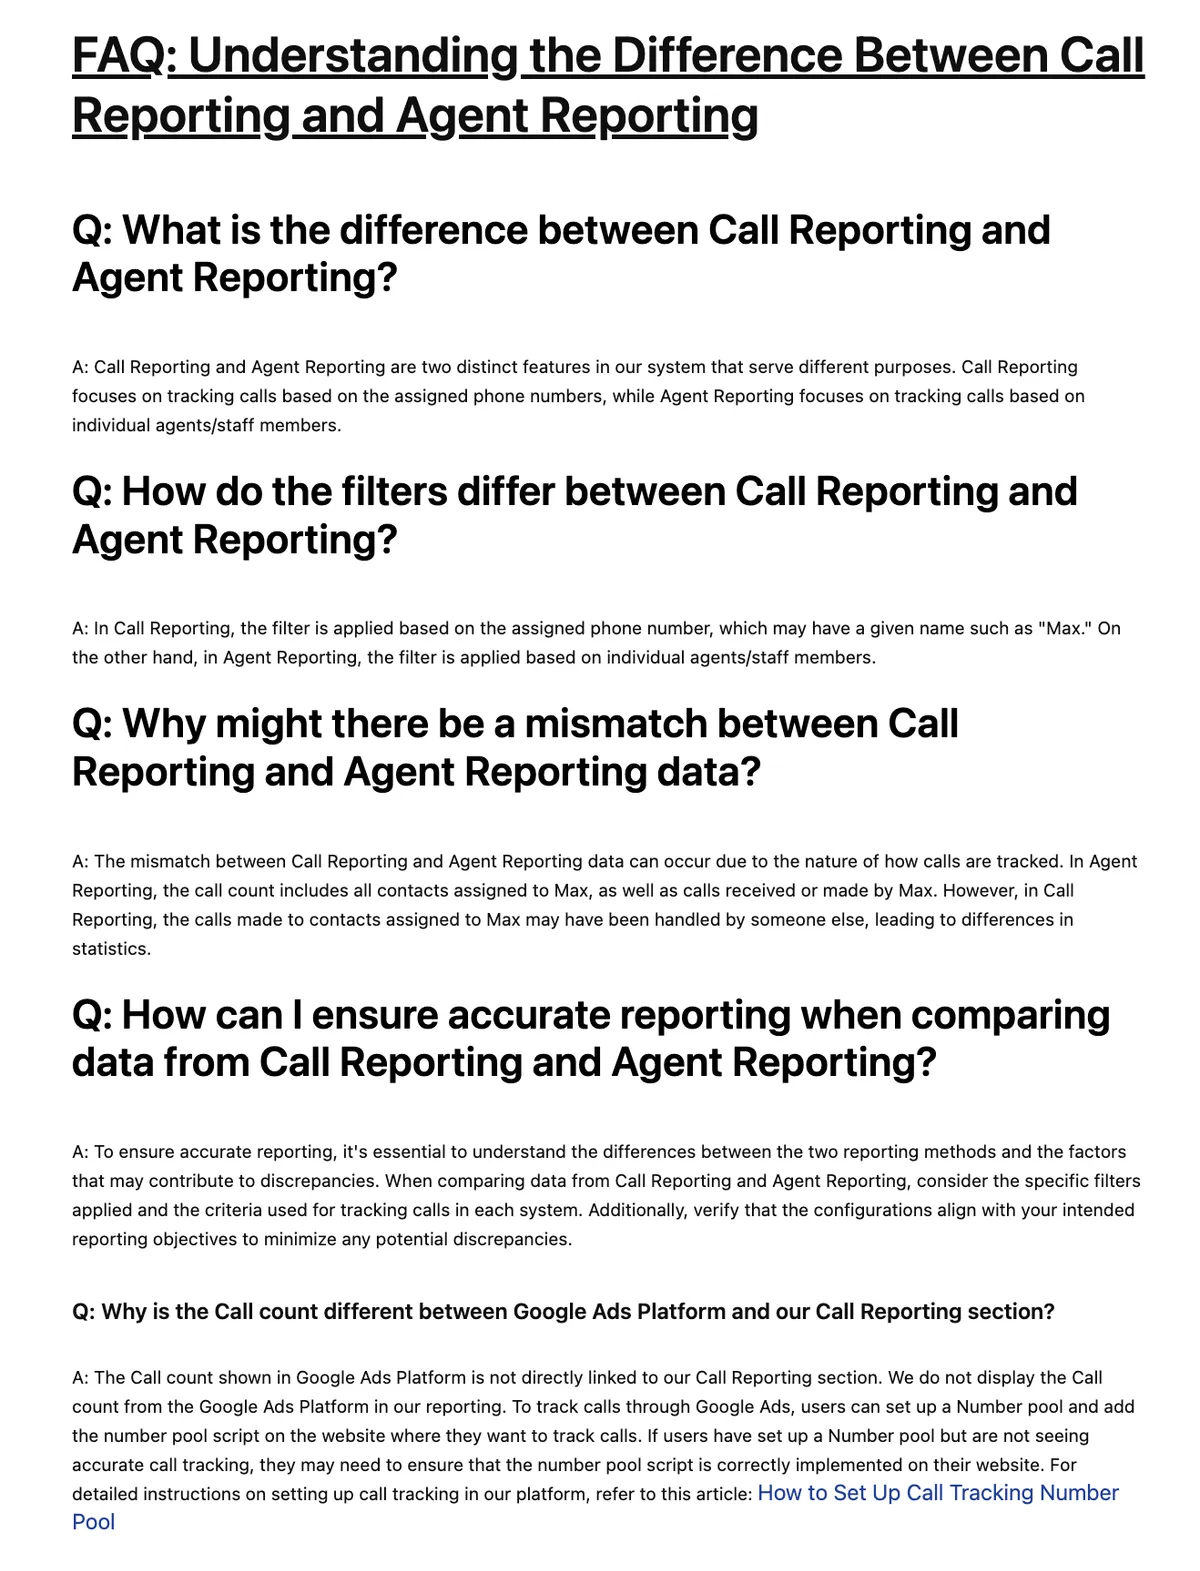
Shows calls answered, missed, by source, and total call volume, along with a browsable log of previous calls. Use the filter tab to narrow by date range or source, or export to CSV for deeper analysis outside the platform.
Appointment Reporting
Shows confirmed and booked appointments, along with outcome breakdowns: show, no-show, and canceled. Also displays the source/channel each appointment came from and who created the booking, useful for spotting patterns (a specific source consistently producing no-shows, for example).
.
Ad Campaign Reporting
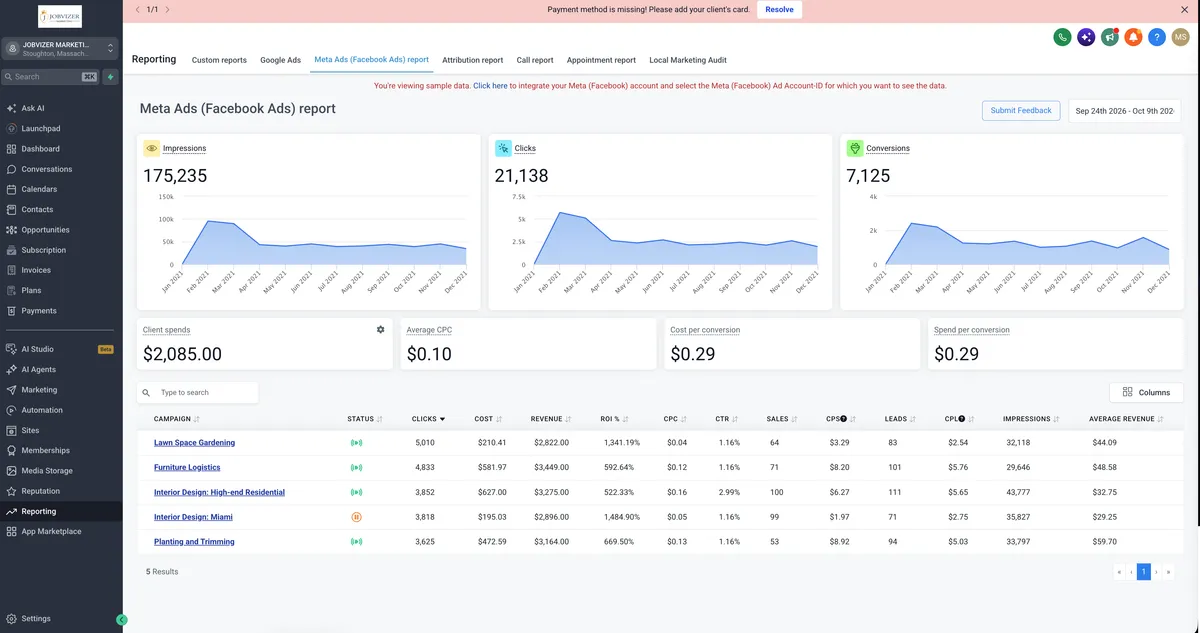
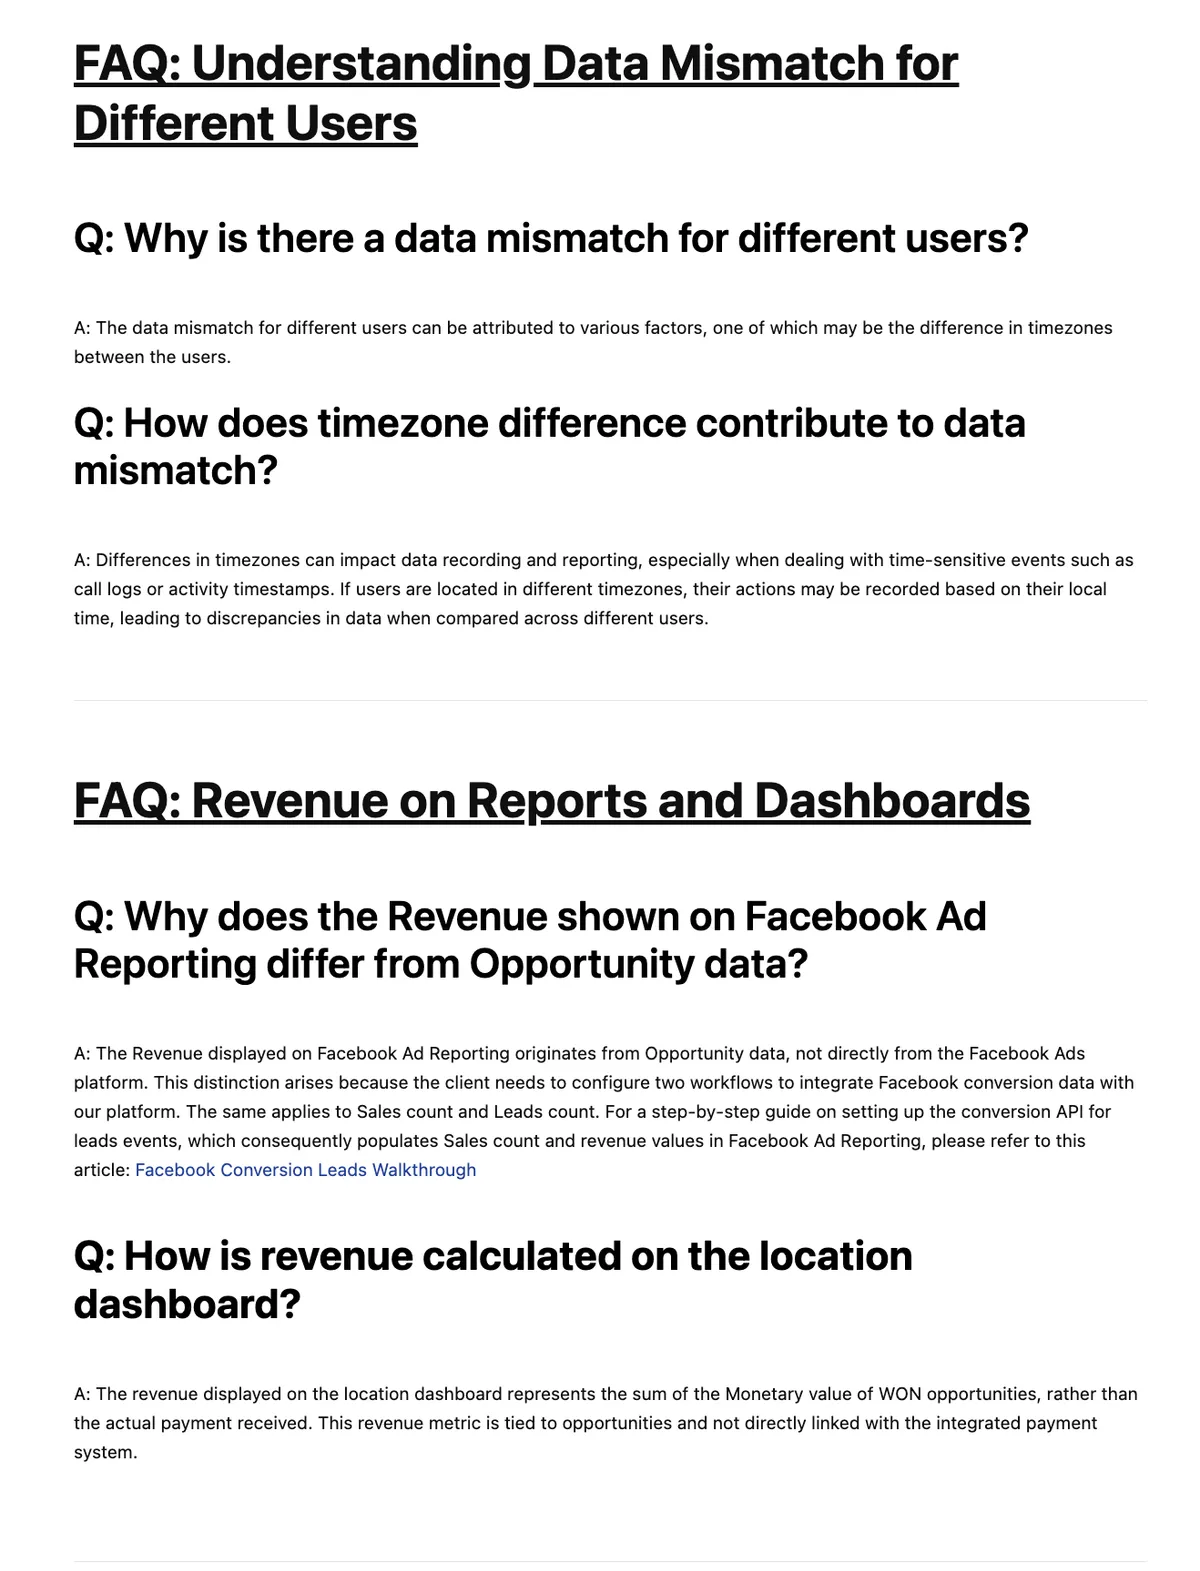
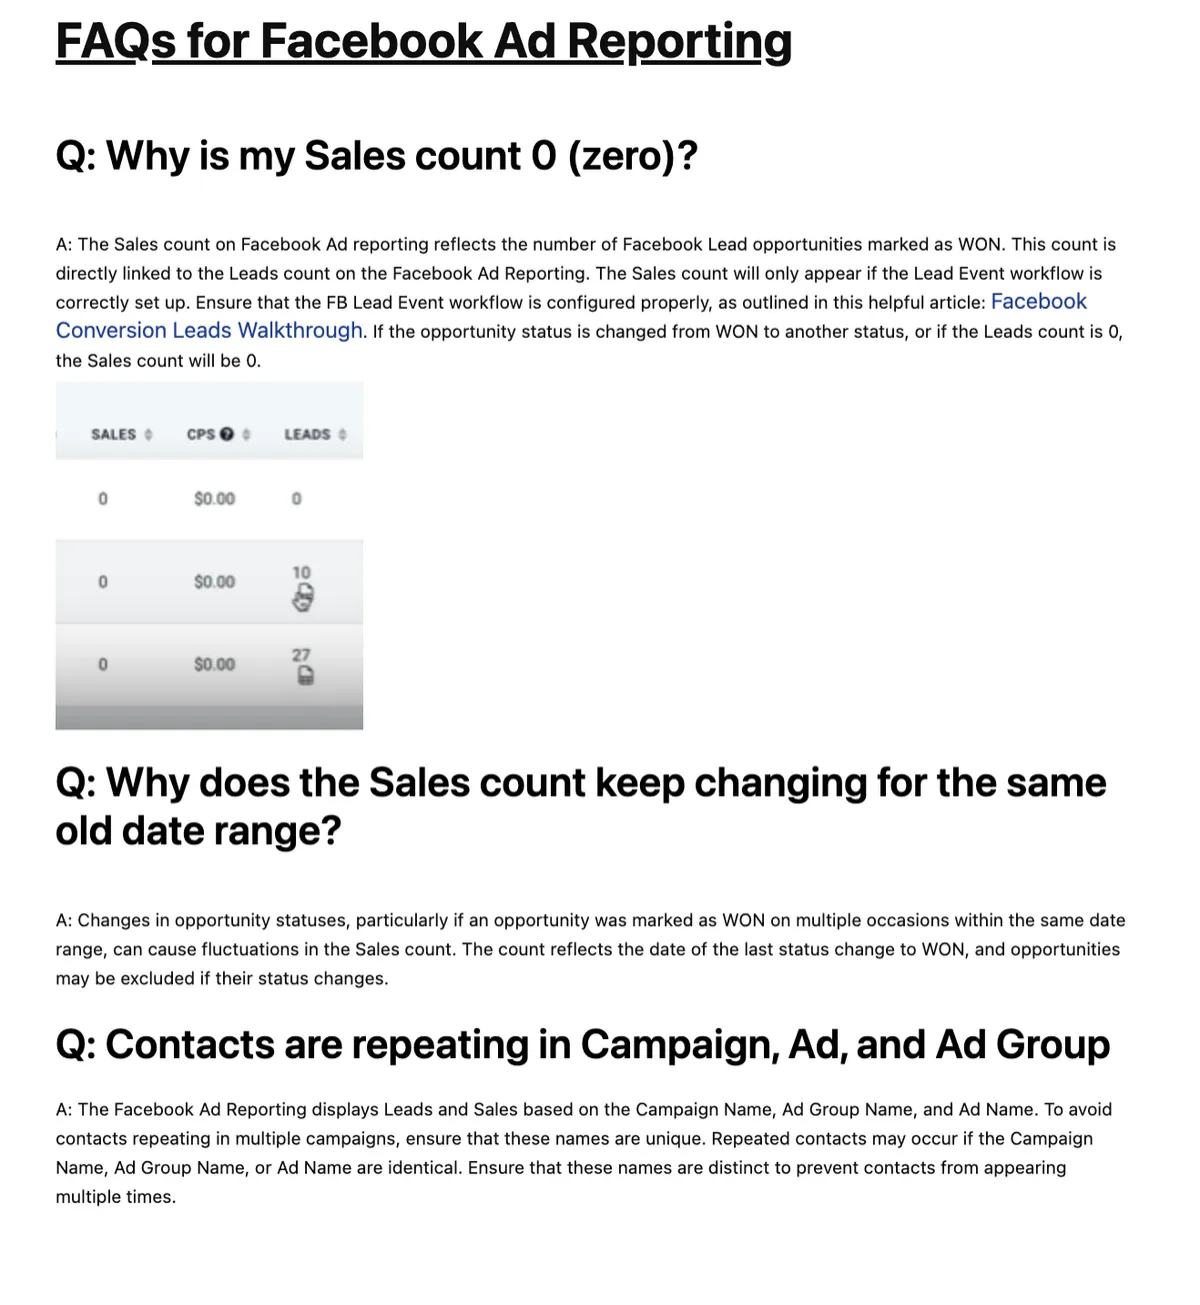
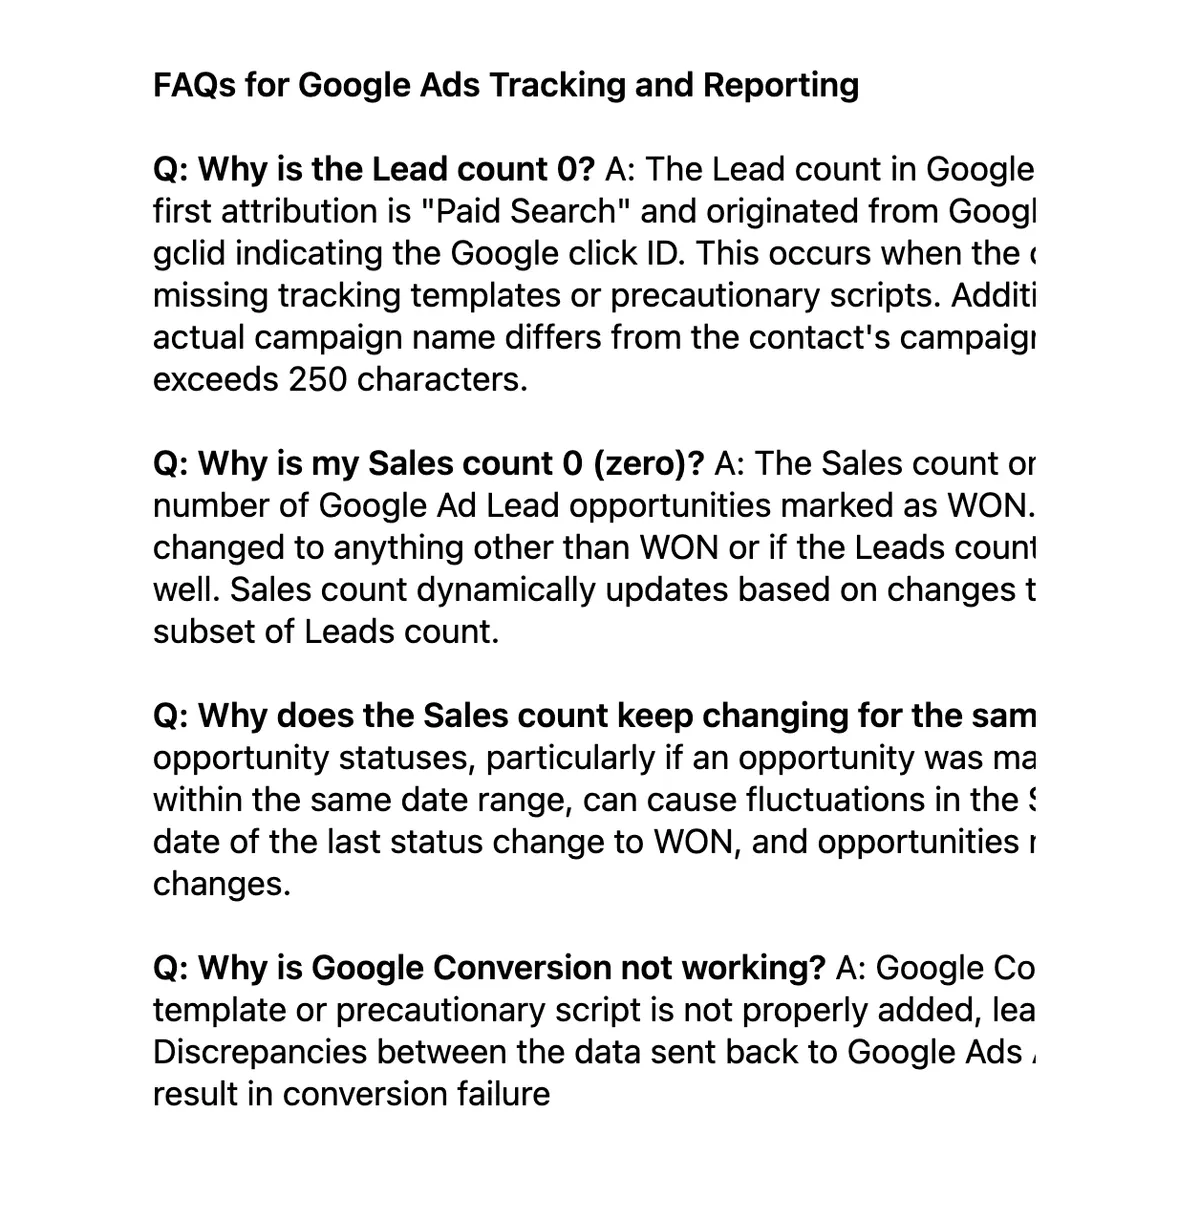
Google Ads and Facebook Ads can be integrated directly, once connected, key campaign metrics display inside the Reporting tab without needing to check the ad platform separately for basic performance tracking. (Note: full ad spend, impressions, and cost-per-click detail still lives natively in the ad platform's own dashboard, this integration surfaces conversion data tied back to CRM activity, not a full replacement for the ad platform's own reporting.)
Pipeline and Revenue Reporting
Inside the Opportunities module:
Pipeline value by stage, number of opportunities per stage
Conversion rate between stages
Average deal value and win rate
Average time-in-stage
Revenue Forecasting: The Forecast tab shows probability-weighted revenue projections across all open pipeline deals, each deal's assigned probability percentage multiplies its value to produce a realistic weighted forecast rather than simply summing every open deal at full value. This may need to be enabled under account Labs settings if not already active.
The Default Account Dashboard
This is the first screen shown when logging into an account, a rolling, high-level summary: new contacts, pipeline value, appointments booked, open conversations, recent calls, and active workflows. Think of it as the 30,000-foot view, enough to spot whether things are on track, not enough detail to diagnose a specific problem on its own.
Recommended widgets for a typical service business:
New Leads This Week
Pipeline Value by Stage
Appointments This Week
Conversations Needing a Response
Recent Reviews

JOBVIZER MARKETING SUPPORT PORTAL© 2026ALL RIGHTS RESERVED